Measure of Mind

See exactly where your bottlenecks are.

Measure of Mind is a free, in-browser operations simulator. Its main product, Queue Studio, lets you model any service flow — a support desk, a checkout line, a clinic triage, or a production line — by dragging emitters and service nodes onto a canvas and connecting them with streams. Run the simulation and watch entities flow through the network while the app predicts queue lengths and wait times at each step, using the Kingman approximation alongside discrete-event simulation. Find the bottleneck, add capacity, and watch the predicted wait times drop — all before you change anything in the real world. No install, no spreadsheet, no account friction.
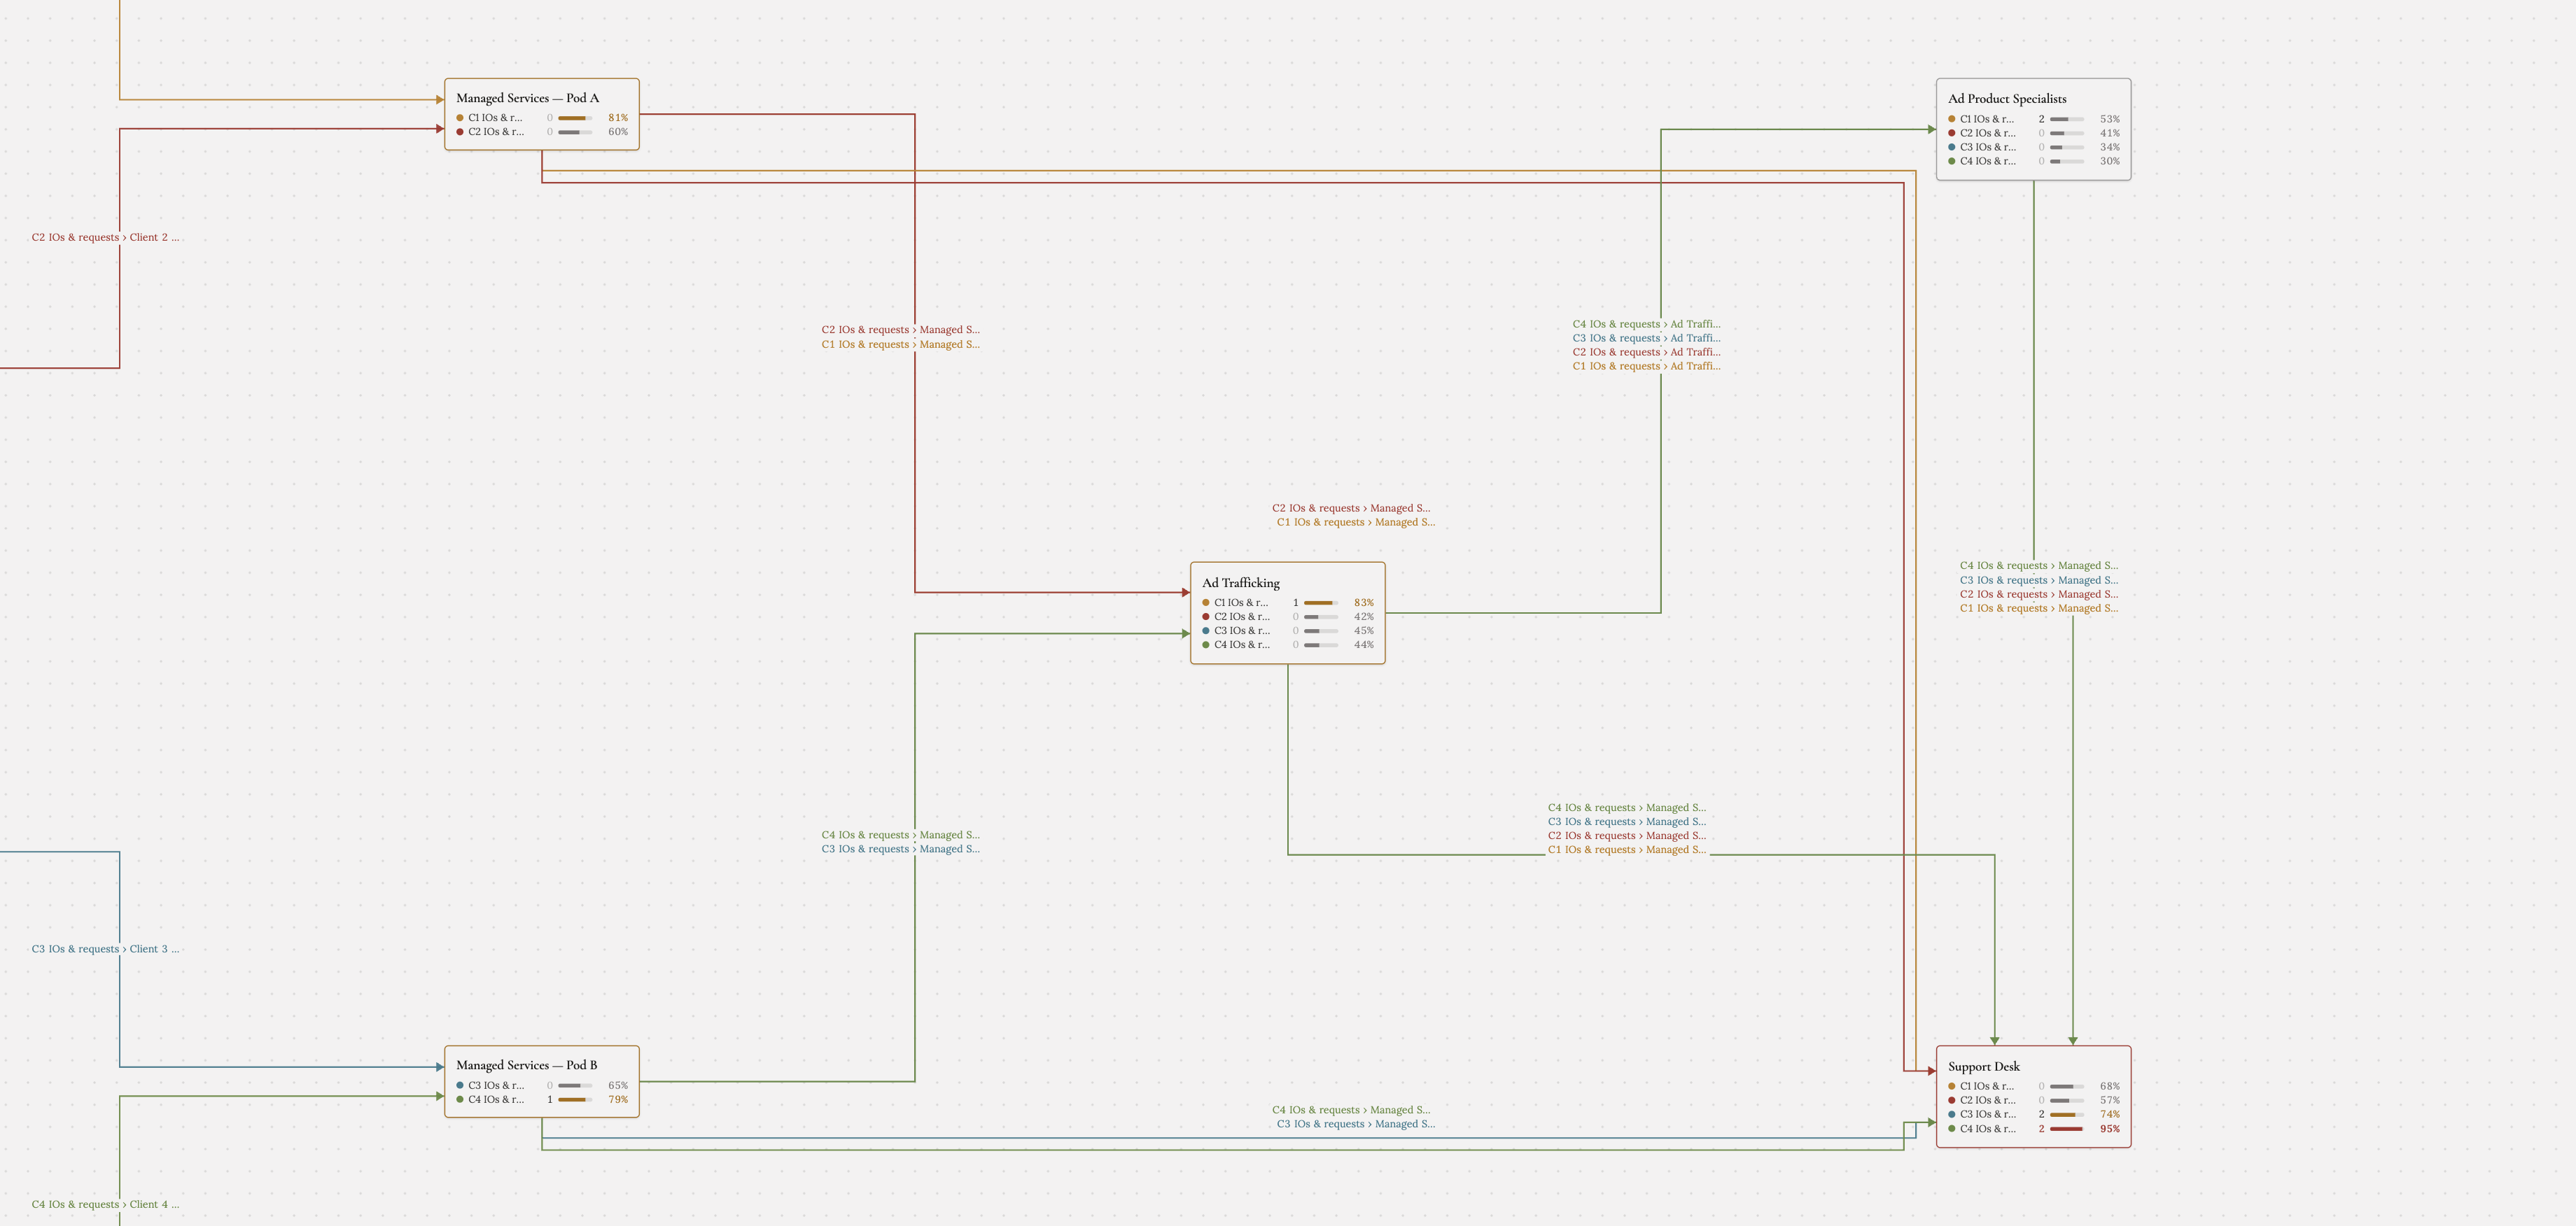
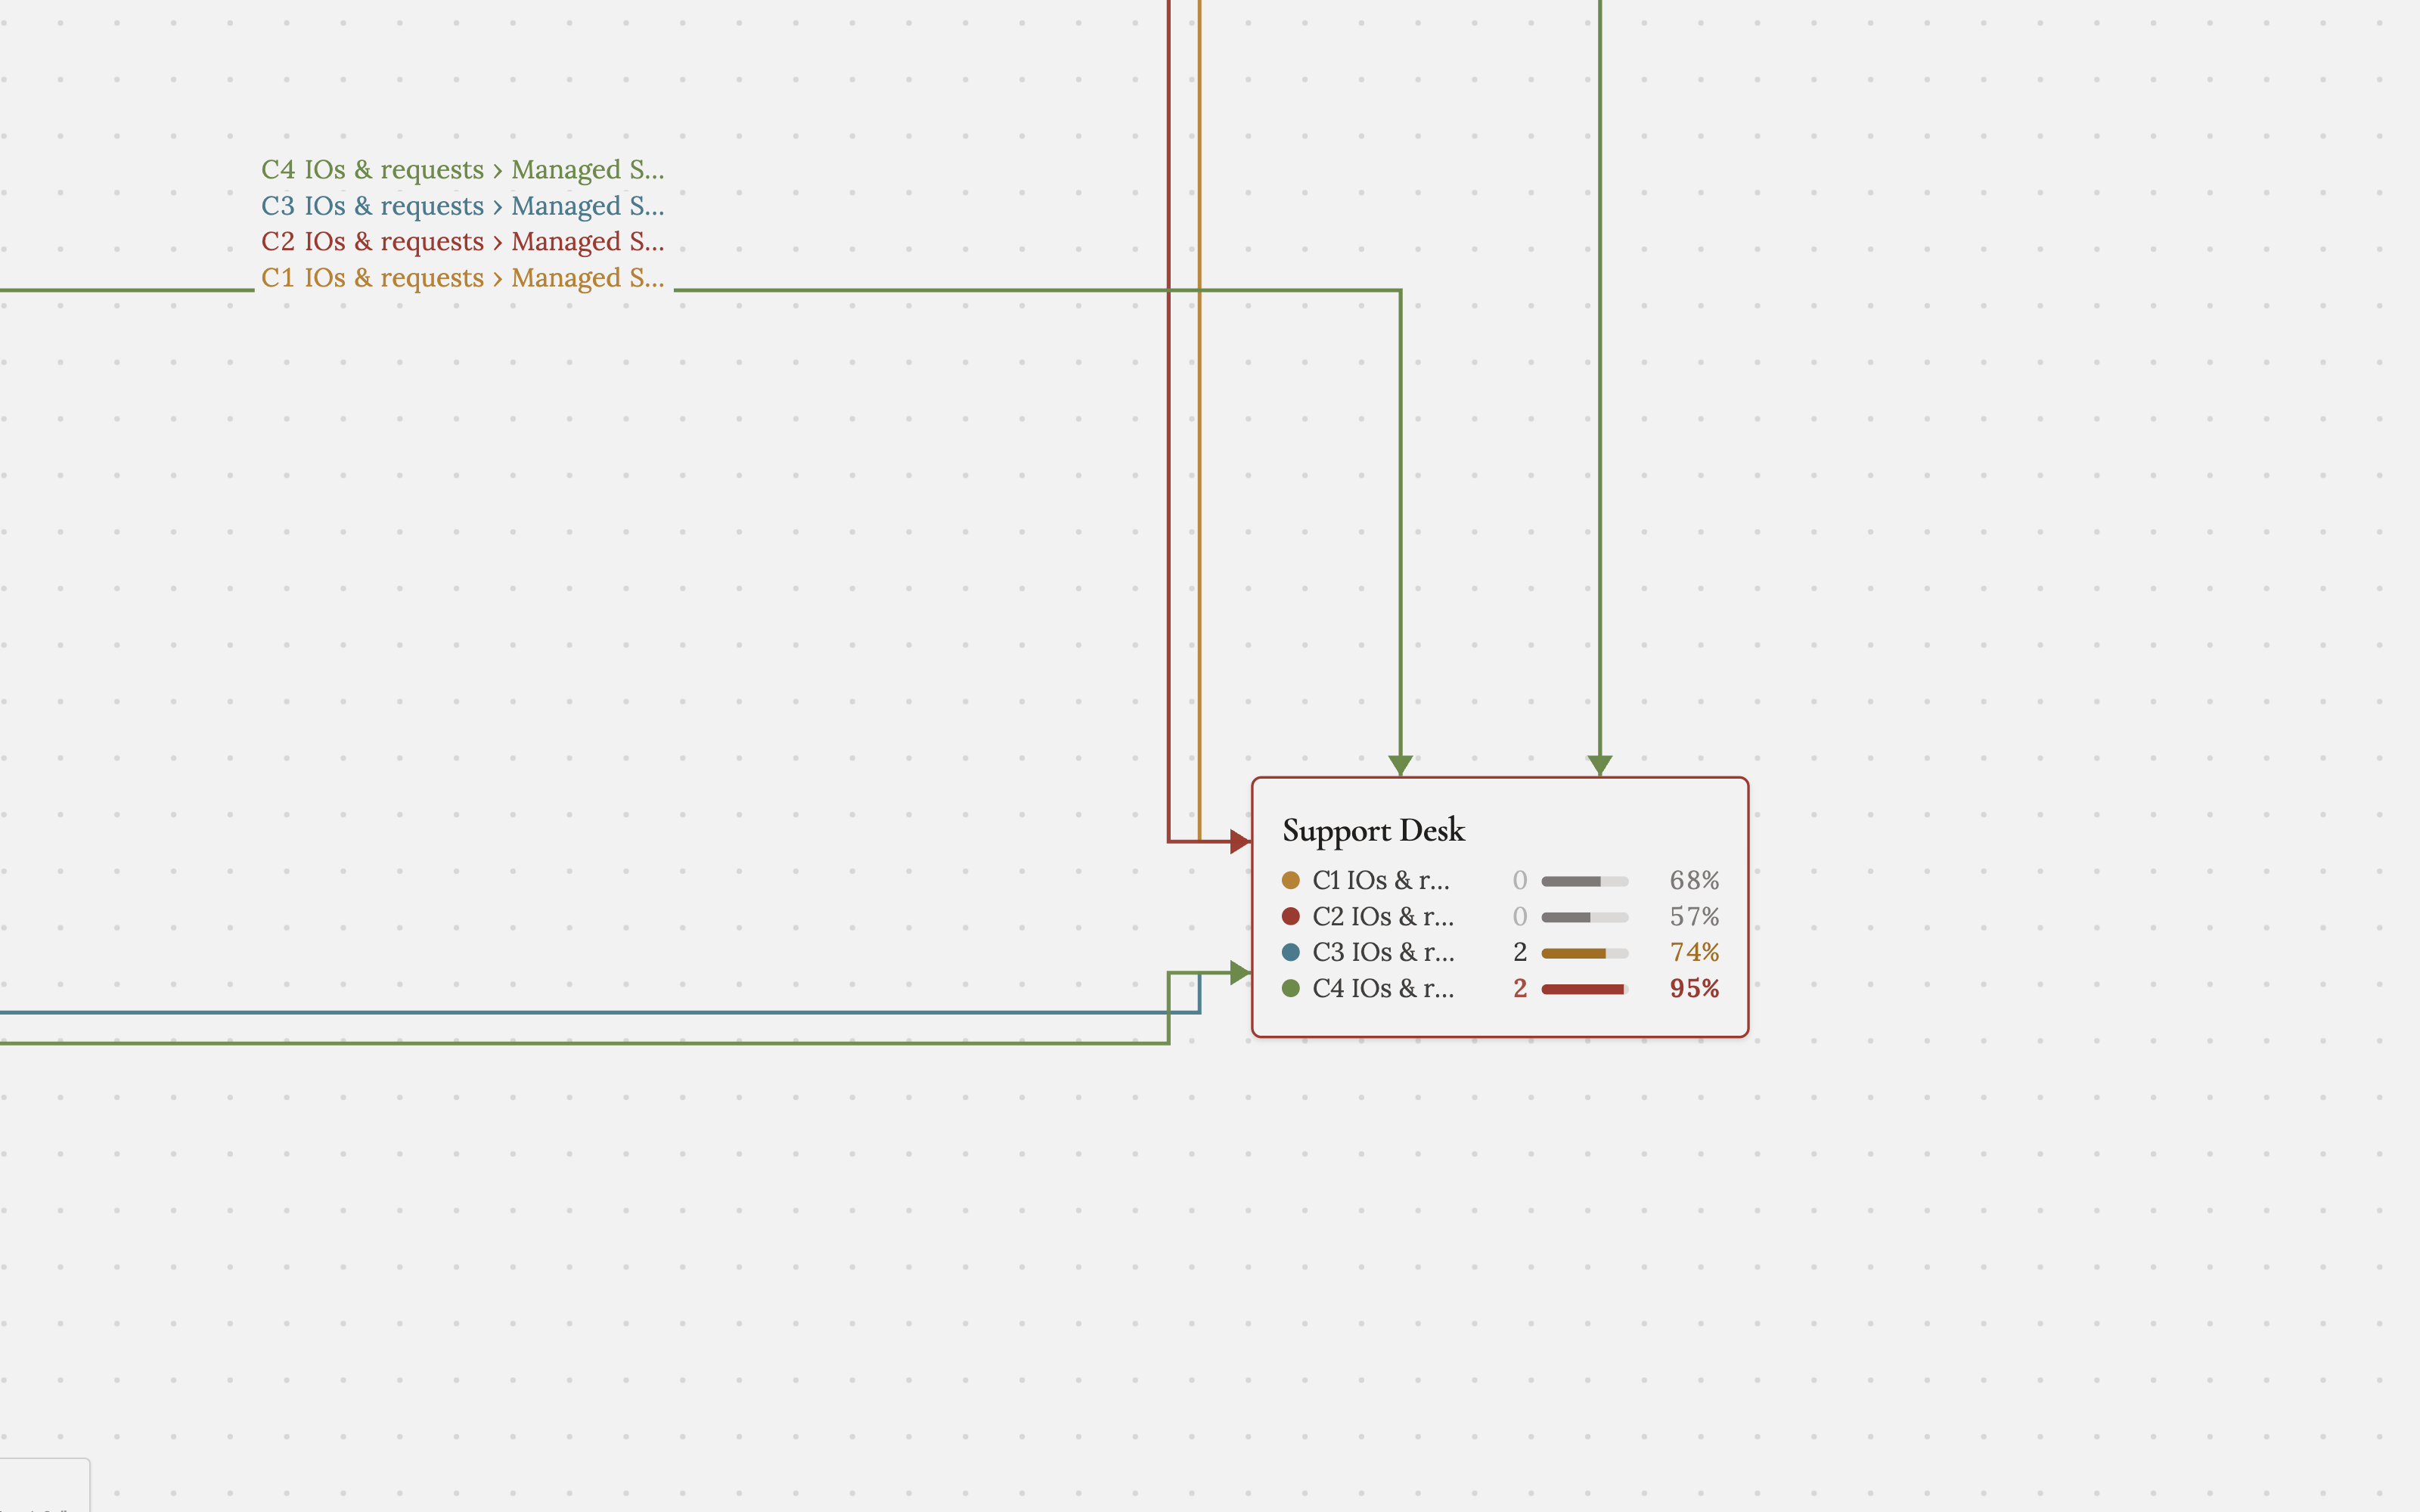
The Measure of Mind board showing service nodes, streams, and a live simulation with per-node utilization and queues — the support desk breached in red

What is Measure of Mind?

Measure of Mind is an operations-simulation company, and Queue Studio is its main product — an educational, in-browser tool that helps you understand how queues and waiting times build up in any service process. A support desk, a checkout, a hospital triage, a production line, or any flow where work arrives and gets served: you lay out the steps on a canvas, set how fast work arrives and how fast each step handles it, and the app predicts where queues will form and how long people will wait. The purpose is simple — see the bottleneck before it happens, so you can decide where to add capacity and measure the improvement. It's free to use, runs entirely in your browser, and keeps your models on your device.

Model the flow. See the wait.

Drag emitters and service nodes onto the canvas, connect them with streams, and the app predicts queue lengths and wait times as you edit — no spreadsheet required.

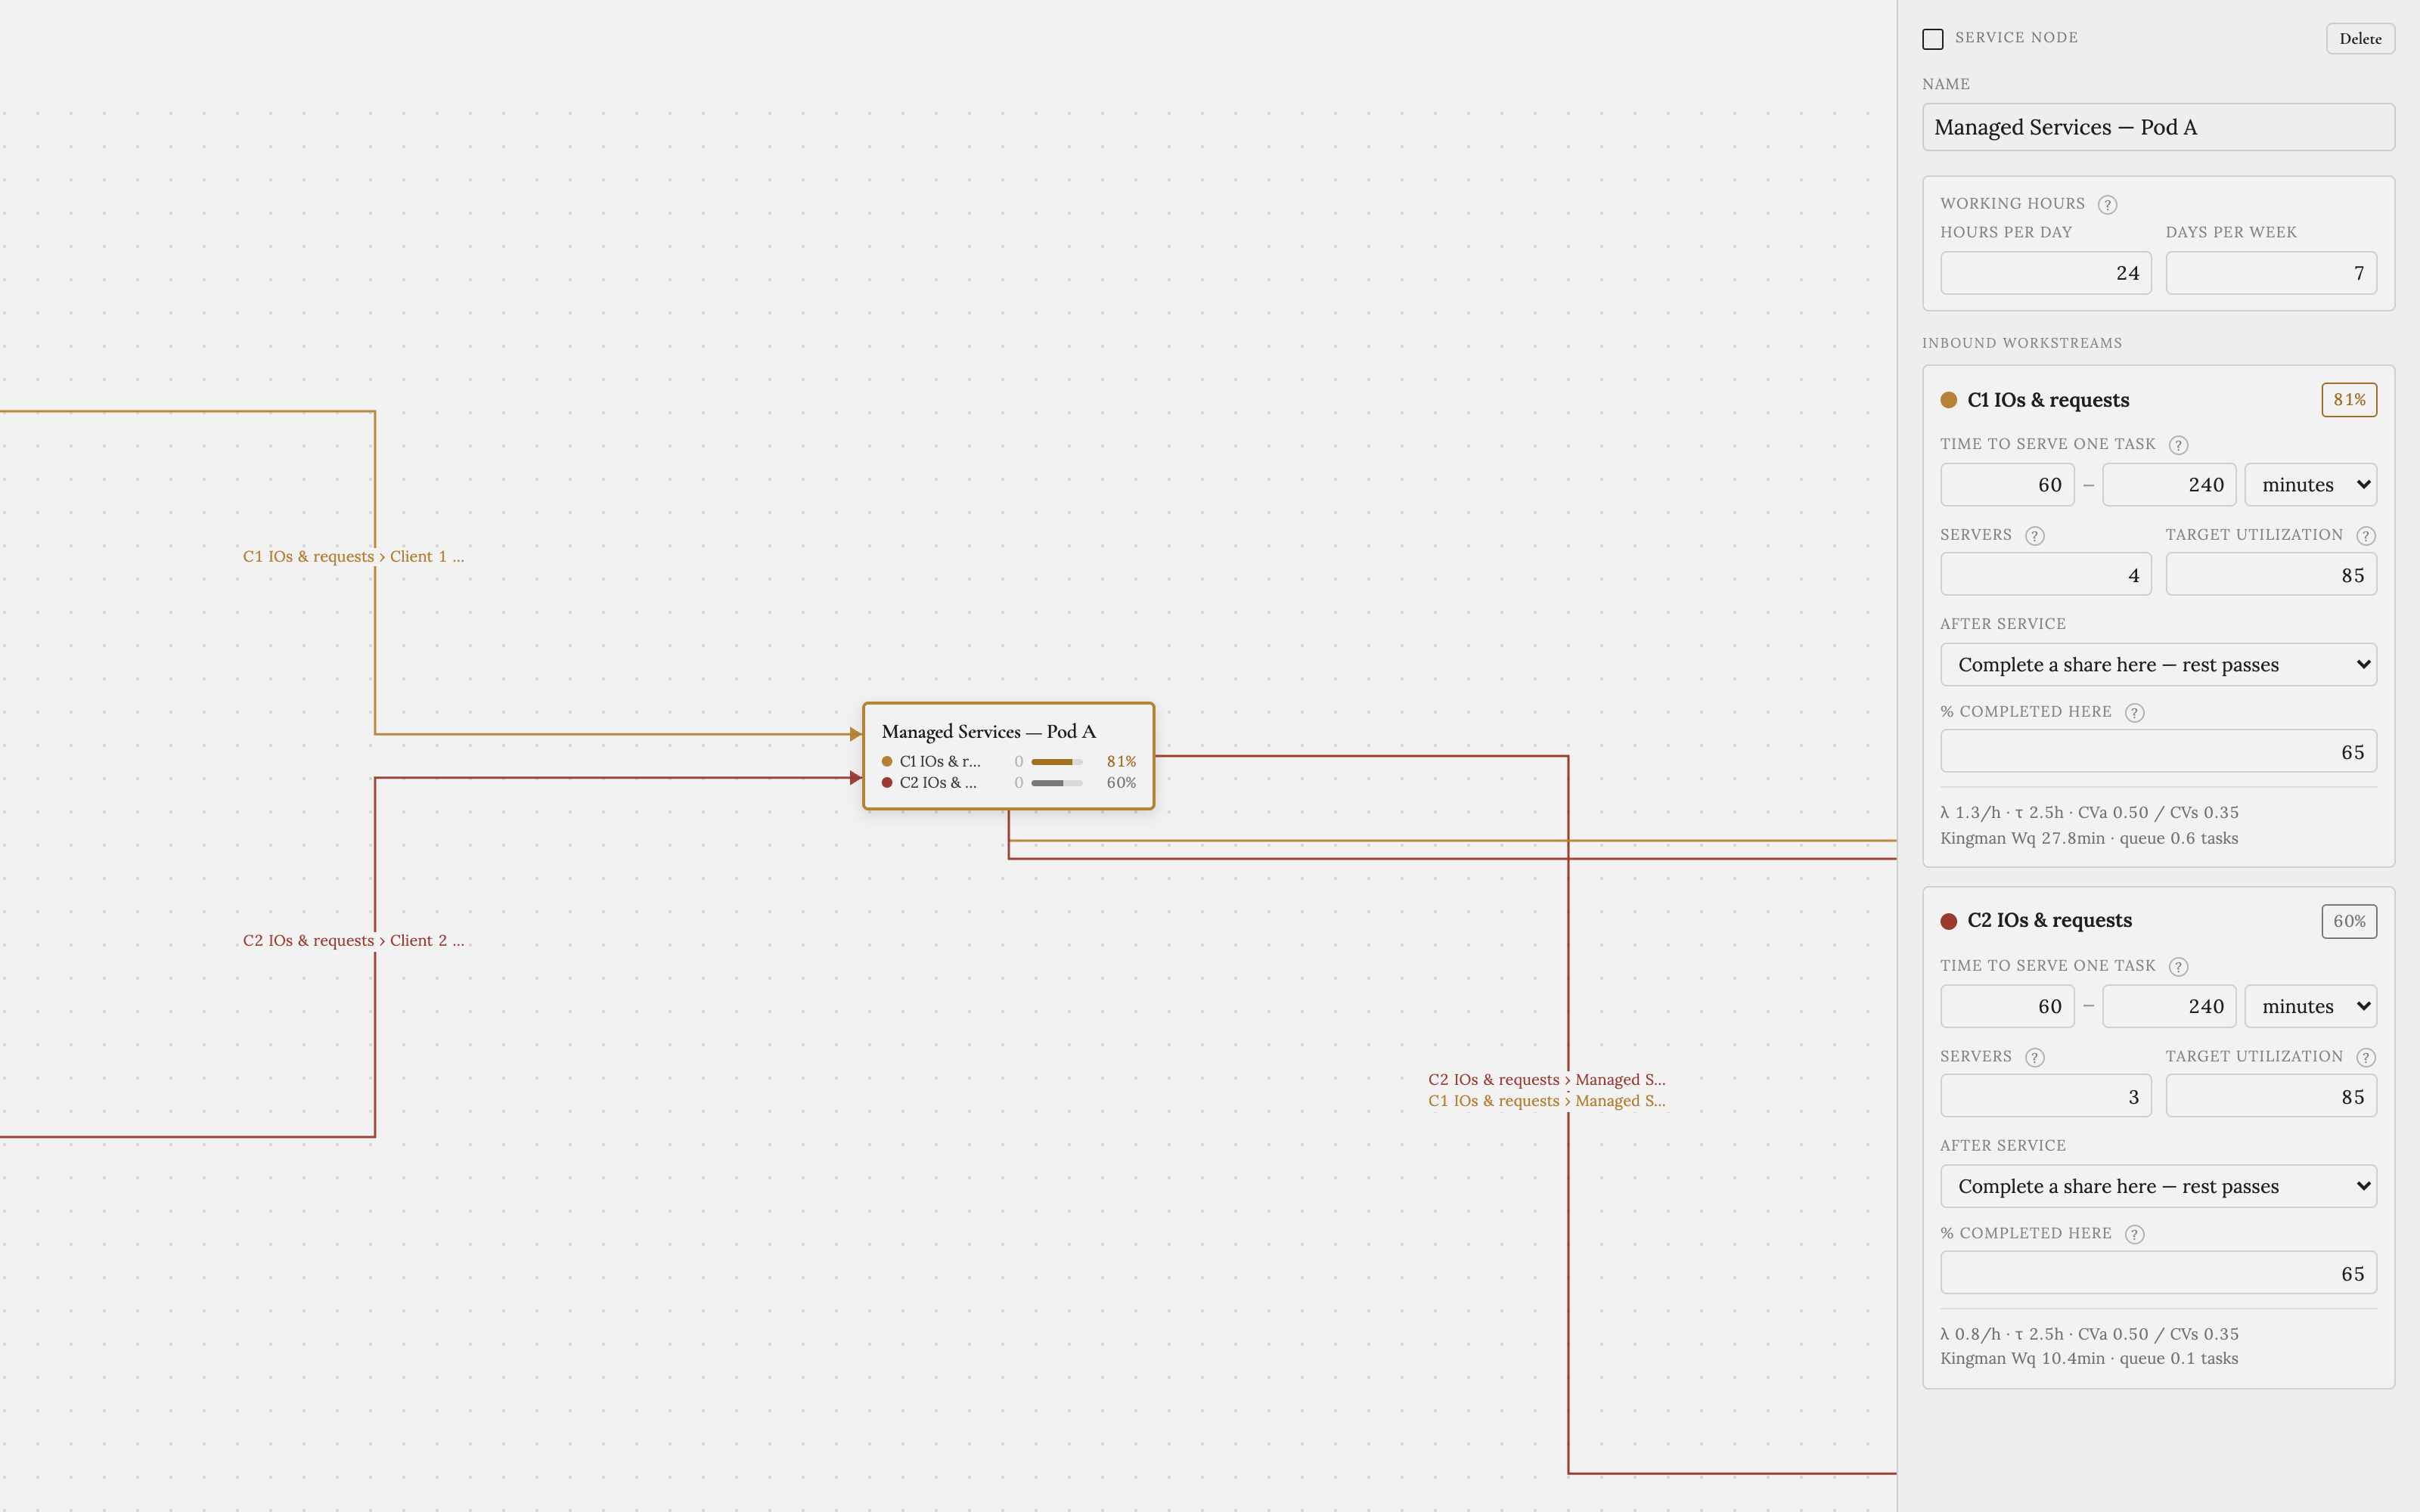
Editing a node with the side panel open

Build by dragging

Place emitters and service nodes, wire streams between them, and tune arrival and service rates in a clean side panel.

A service node mid-simulation showing live queue counts and a breached utilization bar

Run it live

Press Run and watch entities flow through the network. Queues form where capacity is tight — exactly where you'd expect real-world delay.

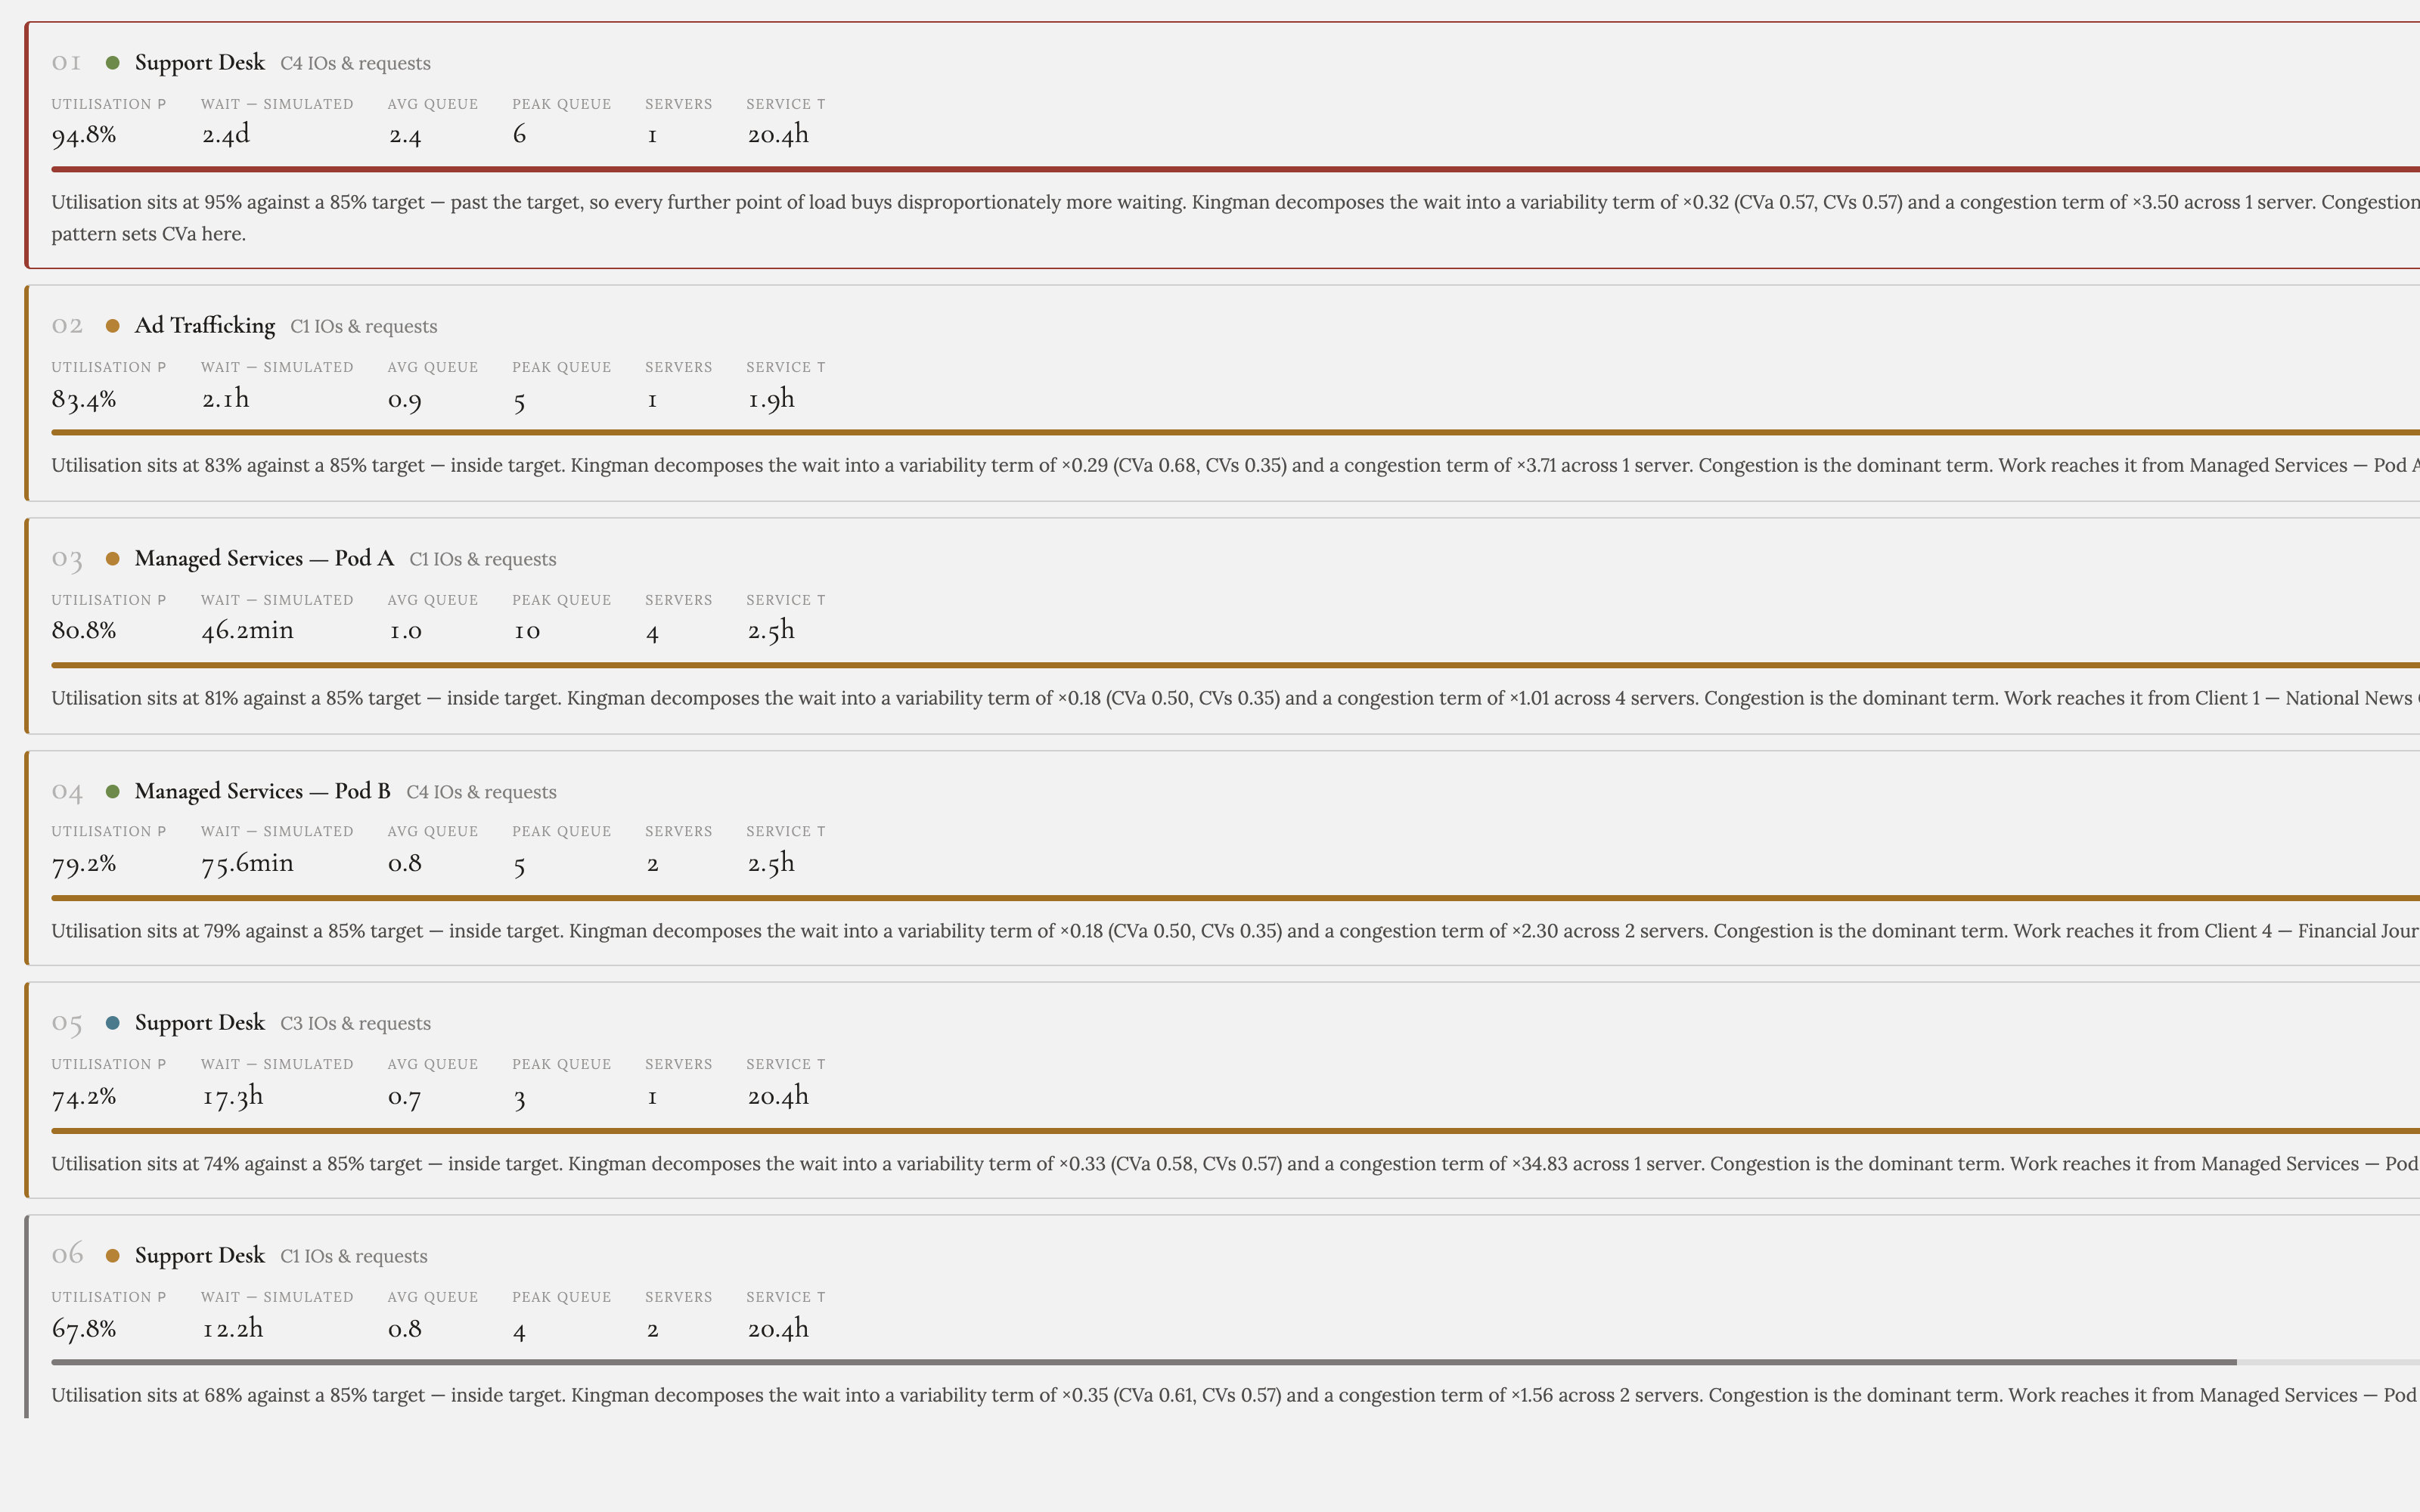
Bottlenecks tab listing the worst constraints

Find the bottleneck

The Bottlenecks tab ranks your constraints so you know which step to fix first — and the Kingman estimate updates as you change it.

Three steps. About a minute.

No account friction — sign in with Google and start modeling.

  1. Sign in

    Use your Google account. We use it only to identify you — we don't collect or sell your data.

  2. Build your board

    Add an emitter, a service node, and a stream. Load the example board or follow the in-app tutorial if you like.

  3. Run & read

    Press Run, watch the queues, and check the Bottlenecks tab. Change a number and watch the prediction move.

It's free. Give it a try.

One click opens the board — sign in with Google and you're in. Your models stay in your browser; export them anytime as JSON.

Try the app